Annotations
Sometimes a chart or map is not enough to clearly communicate the data on its own. Annotations can be helpful for showing when key events occurred, especially when you have a drastic change in the data. With the annotations feature, you can help the audience better understand the context and your argument.
Introduction
This article explains how you can annotate your chart using everviz
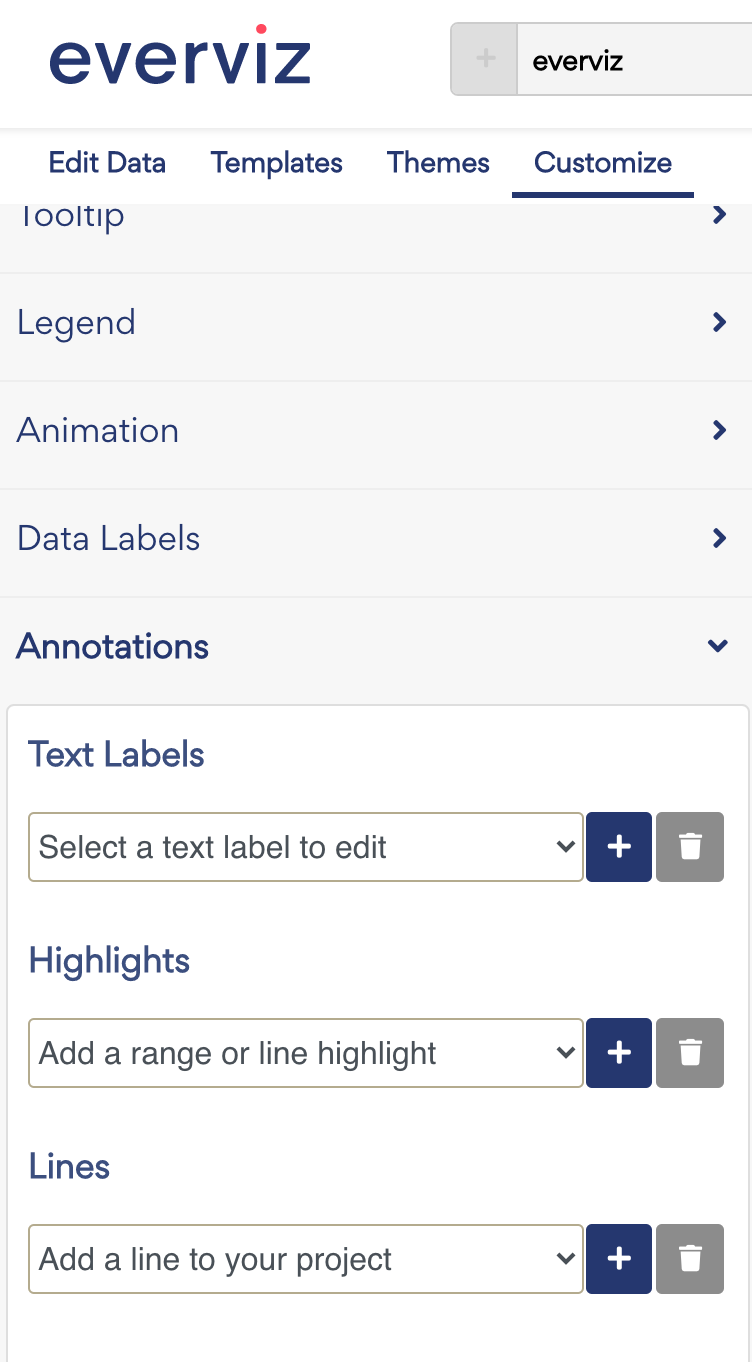
From the Annotations section in the editor you can add the following annotations:
- Text labels
- Highlights
- Lines
The Annotations section is found in the Customize section under Annotations.
Working with Text labels
Add a Text label
To add a new text label
- Click on the "+" next to the Text labels
- Click anywhere in the chart where you want to position the Text label
Now that you have added the label, you can start customizing it.
Position a label
To move a label to a different position, select the label in the preview and move it to a desired position by dragging it with your mouse. When the label is selected you can also drag the handle in the arrow to move the arrow position
Changing text and styling options
When the text label is selected you can customize the following options in the left
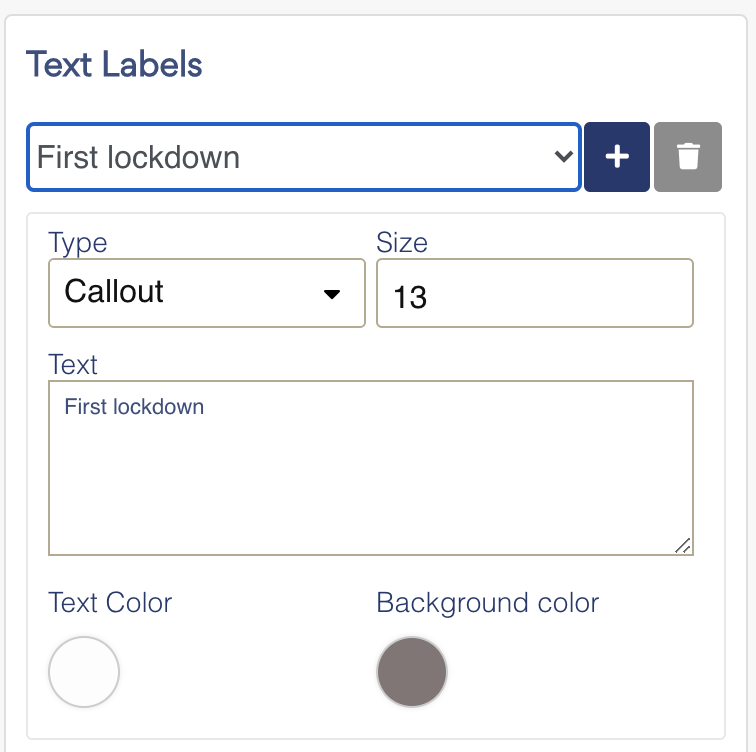
| Text | Set desired Label text |
| Type | Choose between Callout, Connector or circle. The main difference between callout and connector is that the callout supports background color |
| Text size | Set text size |
| Text color | Set text color |
| Background color | Pick background color for the Label |
Delete a label
To delete an existing label, select the label and click on the delete icon, or hit the backspace key on your keyboard.
Responsive text labels
To support responsiveness in the chart, the text label will be shown as a number reference on small screen sizes and the text you have entered will be displayed below the chart. See the following screencast as an example
Working with Highlights
When you create charts, sometimes there are area you want to point out or put some focus on....or maybe just highlight!
Here are two examples showing the concept:
- Chart with a horizontal highlight range
- Chart with two vertical highlight lines:
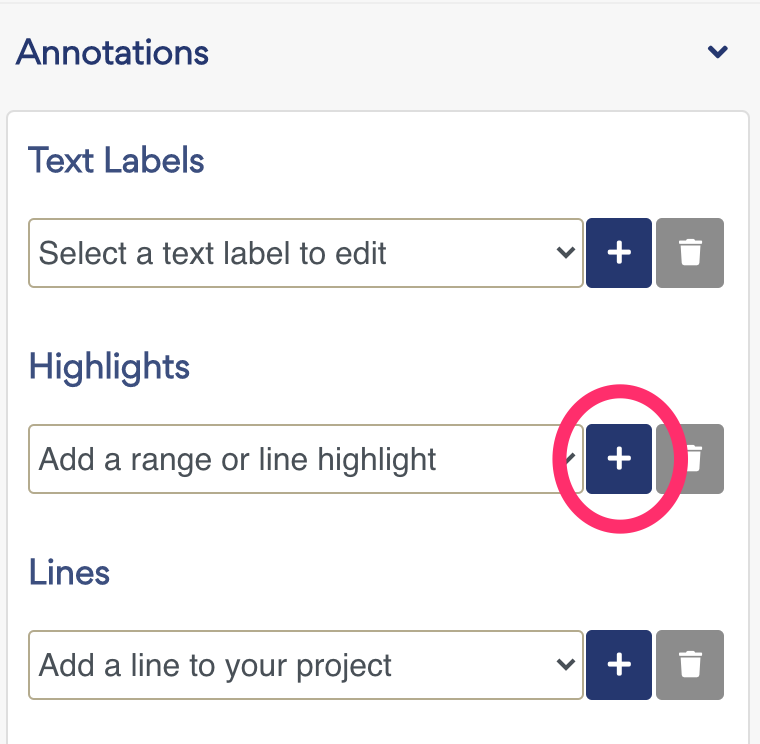
Add a Highlight
To add a new Highlight, click on the "+" button
Position a Highlight
To move a Highlight to a different position, select the Highlight in the preview and move it to a desired position. Drag the handles to resize the highlight range
Changing text and styling options
When you have selected a Highlight, the you can select the following options in the editor on the left:
| Highlight type | Choose between Range or line |
| Orientation | Choose vertical or horizontal orientation of the Highlight |
| Label | Insert optional label for the Highlight |
| Label color | Pick a label color |
| Color | Pick a color and transparency value for the Highlight |
| Vertical Align | Vertical align for the label. Top, middle or bottom |
| Horizontal Align | Horizontal align for the label. Center, left or right |
Delete a Highlight
To delete an existing Highlight, select the Highlight and click on the delete button.
Working with Lines and arrows
Adding a "hand-drawn" line can also be useful if you want help your audience better understand the context and your argument.
Here is a sample showing the concept
Add a Line or arrow
To add a new text label
- Click on the "+" next to the Lines section
- Click anywhere in the chart where you want to position the Line
To move a Line to a different position, select the Line in the preview and move it to a desired position. Drag the handles to resize or change the line orientation
Change styling options
When you have selected a Line, the you can select the following options in the editor on the left:
| Type | Choose between Line or Arrow |
| Size | Set line size |
| Line color | Pick a Line color |
Delete a Line
To delete an existing Line, select the Highlight and click on the delete button.