Working with axes
Here are some common workflows for adjusting the look and feel of the horizontal x-axis and the vertical y-axis.
Axes elements that can be customized in include the axis label, axis line width, axis ticks, color and more.
How do I add symbols to the x- or y-axis?
Symbols such as %, £, $ etc. can be used to describe the x- or y-axis values.
- Go to Customize > Basic > Axes (X Axis or Y Axis) > Axis labels format
- Then add a symbol before or after the {value} label.
- Here, a euro sign (€) is added to the y-axis labels.

Turn an axis title on and off
The axis title is located next to the axis labels.
- Go to Customize > Advanced > Title > Enabled
- Check On to enable Off to disable
Can I change the axes title's font family?
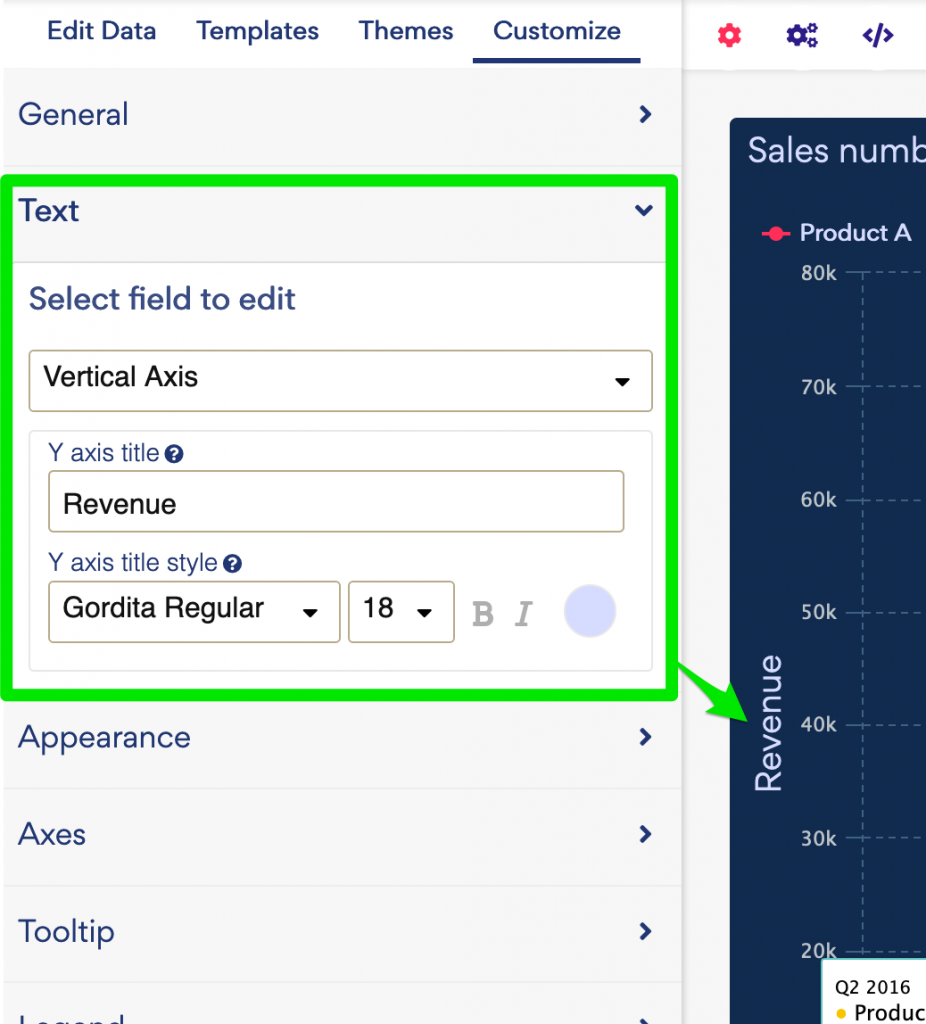
Yes, here are the steps to change the axis title’s font family:- Go to Customize > Basic > Text > Y Axis 1 or X axis 1
- Enter an axis title and click the pencil icon to open the rich text editor to select a font.

How do I add an additional Y axis?
To add another Y axis:
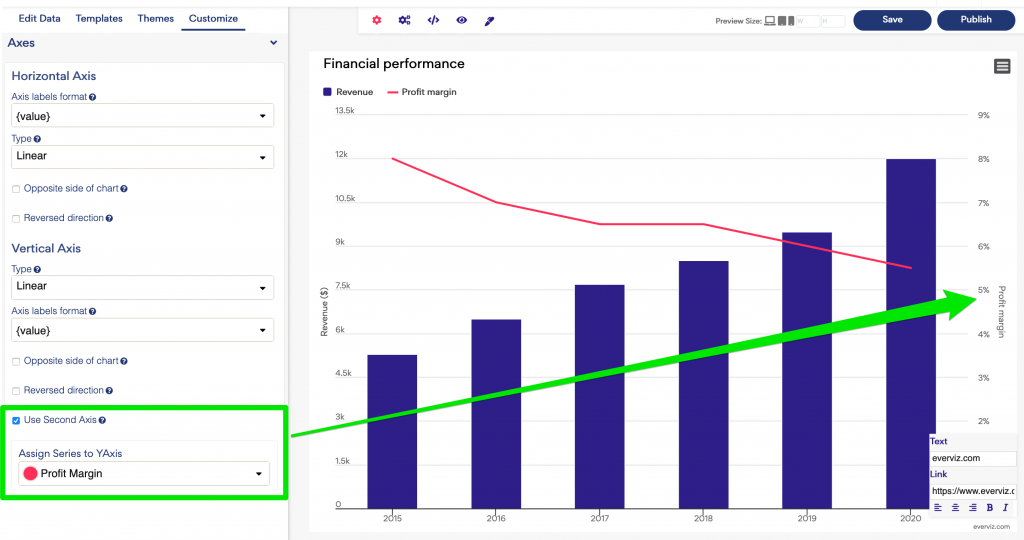
- Go to Customize -> Axes -> Vertical Axis, then check "Use second axis"
- Choose which serie the axis should be connected to in the dropdown "Assign series to YAxis"

How do I delete a x- or y-axis?
To delete a x- or y-axis go to:
- Customize > Advanced > Y Axis or X Axis, then click on the sign minus to delete an axis.

How do I move the Y axes to the opposite side?
To move the Y axis to the opposite side:
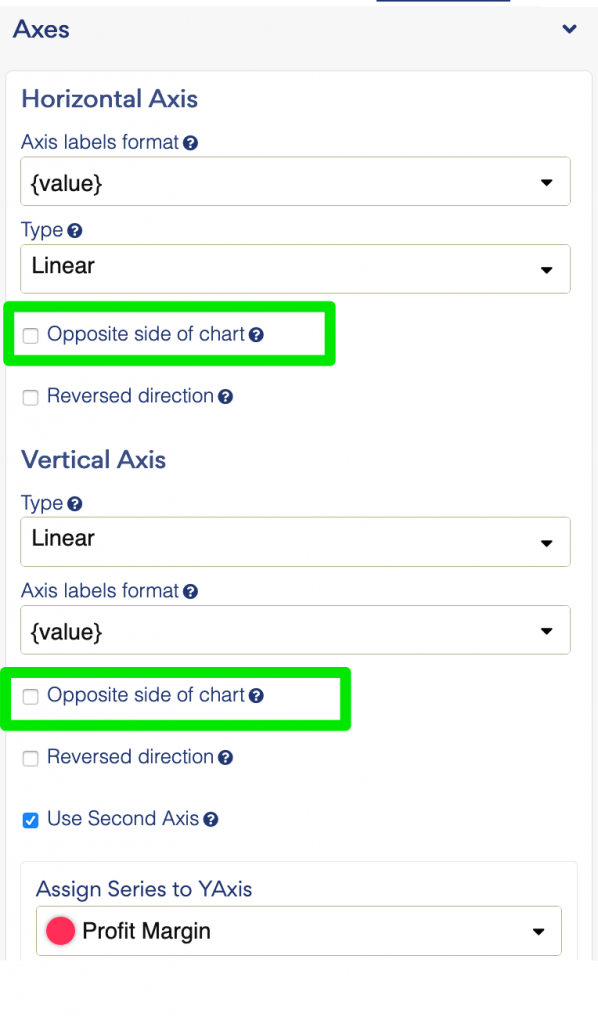
- Go to Customize ->Axes. Tick the opposite side of chart on your desired axis.

How do I change the color of the axes labels?
Labels are values along the x or y axes, e.g. months along the x axis or numbers along a y axis. In the everviz default theme, labels have a grey color.
Labels in grey and labels in black:


To change the label color:
- Go to Customize > Advanced > Labels > X Axis 1 or Y Axis 1 (depending which label you want to change) > Style > Color
- Click the color picker and select from the pallet or enter a hex code
How do I add tick marks to an axis?
Tick marks are the small dashes extruding from an axis. They show the exact point on an axis that the label defines. Tick marks should be the same color as the axis.

To add tick marks to an axis:
- Go to Customize > Advanced > X axis 1 > Tick width
- Enter a value in the Tick width field, for example '1'

- Adjust the length of the tick in the Tick length field
Tip: Type '0' to remove the tick marks.
Other tick mark options in the advanced menu:
Change tick mark color
- Under Tick Color click the color picker and select from the pallet or enter a hex code

How do I adjust the font size of the axis labels?
Go from this:

To this:

- Go to Customize > Advanced > Labels > X Axis 1 or Y Axis 1 (depending which label you want to change) > Style
- In the Font size field enter a size

How do I start my y-axis at 0?
Go from this:

To this, where the y axis minimum is set to 0:

- Go to Customize > Advanced > Y Axis 1
- Next to Min enter a desired minimum value of the axis or use the arrow keys.
