Series
In this article:
- How to change the series’ colors?
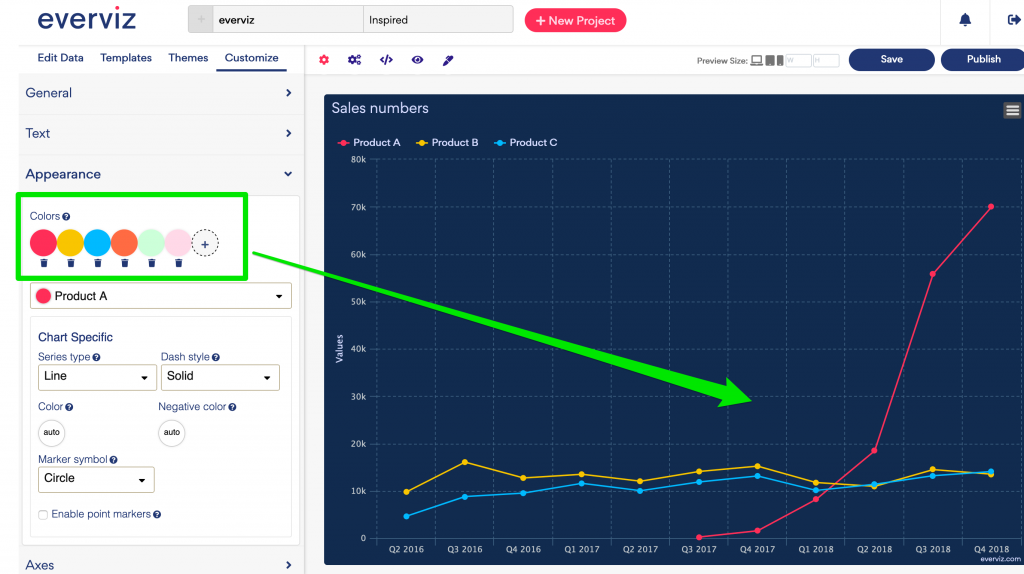
To change the series’ colors:
Go to Customize -> Appearance
Select the series that you want to change the color.
Choose the color from the Color button.
- How to change the series default colors?
Go to Customize -> Appearance, then add or delete the colors of your choice.
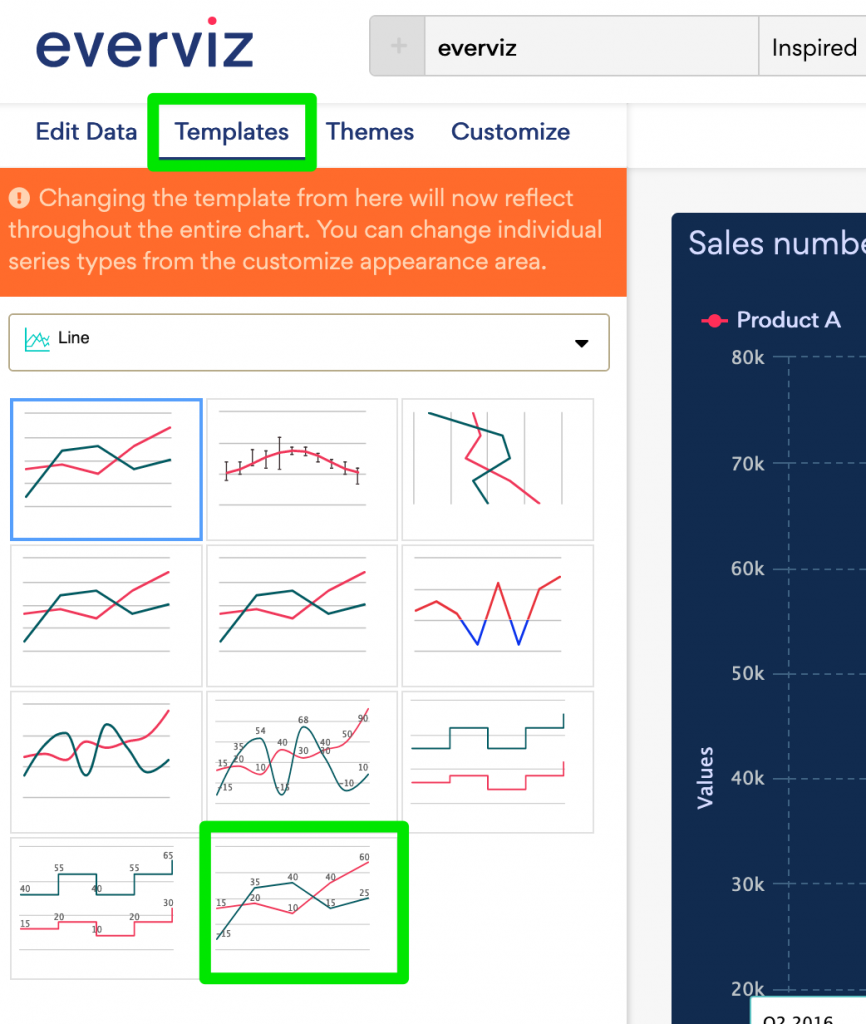
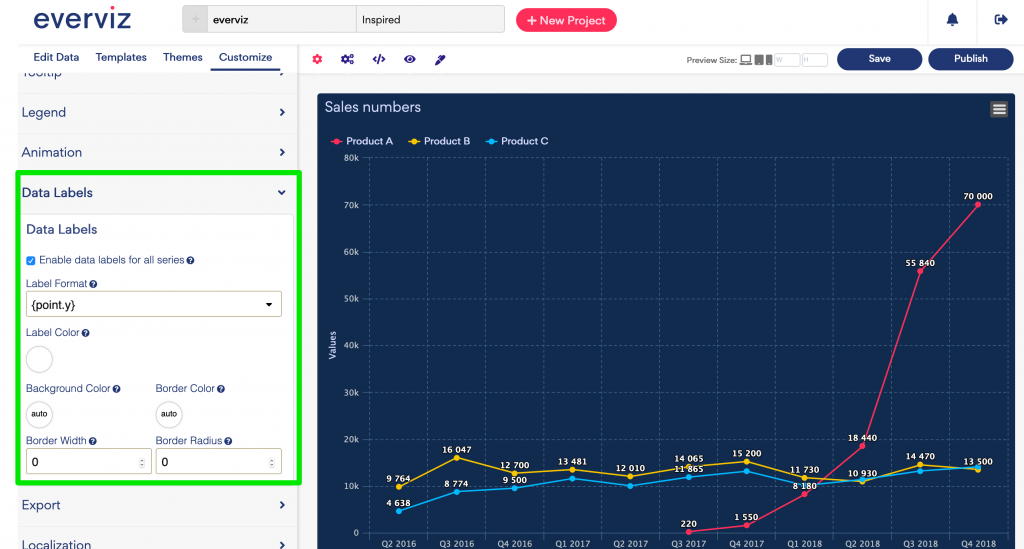
- How to display Data Labels?
To display data labels on top of each point, you can either select a template with the data labels enabled or enable data labels in the editor
1. To choose a template with data labels enabled by default, go to Templates, then select the type with labels.
2. To enable data label, go to Customize -> Data Labels then check the Enable data labels for all series option.
- How to delete series?
To delete a series, you can do this from the "Edit data" panel. You need to:
- Click the settings icon
- Choose your series from the dropdown
- Click the delete button
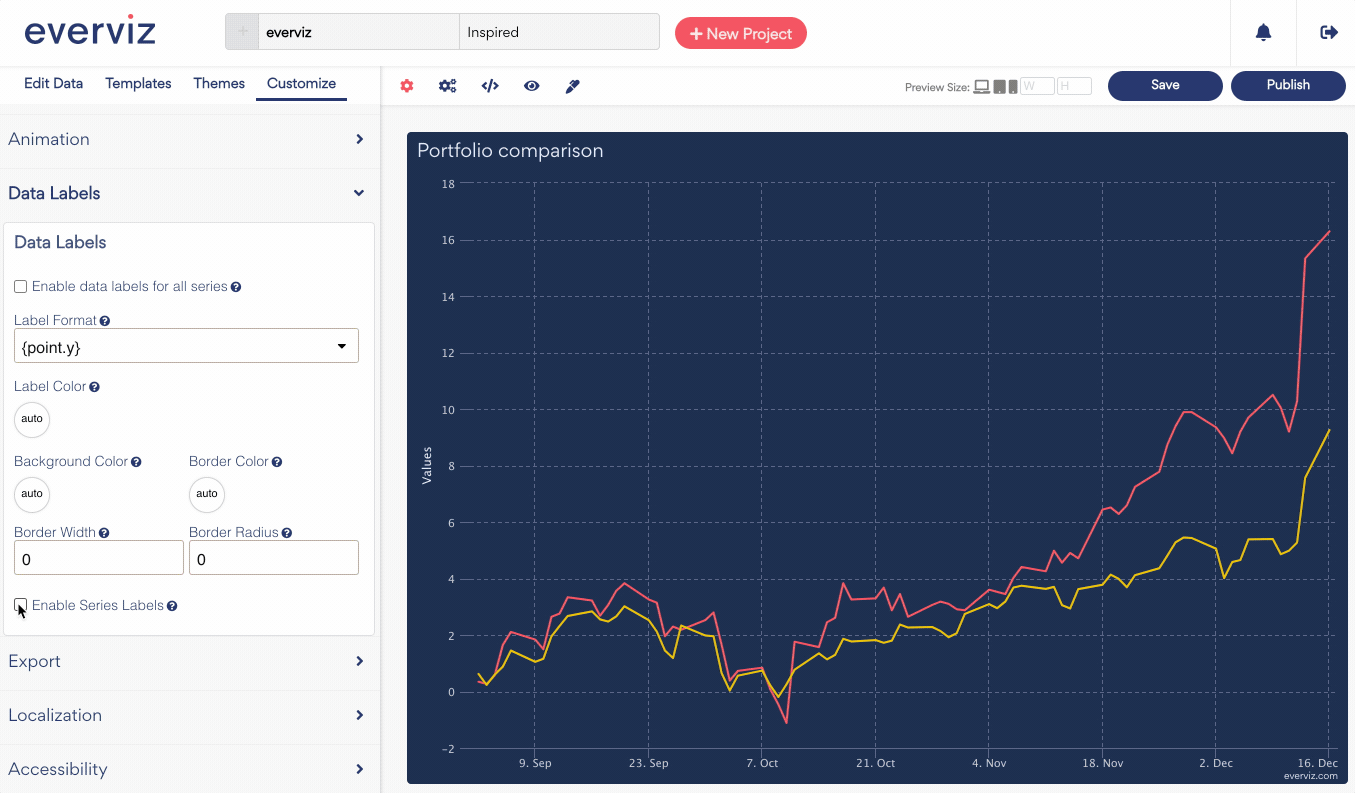
- How to display series labels?
Sometimes it is easier for the viewers to read the chart when the labels are placed next to the series to avoid zig-zagging eyes between the lines and the legend.
To enable Data Series labels, goto basic customizer.
In the Category Data Labels, tick the Enable Series labels checkbox