Customize a table
Now that you have created your first table, it is time for the fun and creative part - Customization.
Overview
Let's start with a quick overview to make it easier for you to navigate in the Table editor.
 1. Left sidebar - Table configuration
In the table editor on the left side, you can customize the features of the entire table, such as sorting, search, add charts, logo and much more. All the settings can be saved into an everviz Theme, to make it easier to apply many settings in one go. You can read more about Themes here.
2. Top - Toolbar

The toolbar at the top allows you to customize individual cells in your table. From this toolbar you can align text, change styling, add borders, add links, merge cells and more.
3. Table preview and editor
The Table section is a WYSIWYG (What You See Is What You Get) editor where you can modify cell values
Table features in the left sidebar
In the left sidebar you have access to a wide range of features to lift your design and reader experience of your table.
In this section we will go through all the features.
Change table title
 In the Title section you can customize the Titl field in your table.
Insert a title, choose font, styling options and positioning.
If you untick the "Enabled" checkbox the title will be be removed from your table.
You can change the text of the Title field directly in the preview.
Change table subtitle
 Similar to the Title field, you can add a subtitle to explain your table to your readers.
Add table captions, credits etc.
Use the caption field for adding more information about your table, such as source credits, date and time for last update, footnote text etc.
The text you insert in the caption field will be shown below the table.
Table canvas color and padding
 In the Canvas section you can customize spacing and colour on the canvas, as well as adding extra colour and a border to the top or bottom of the table.
To allow your reader to search in your table, tick the "Search field" checkbox, so it's value shows "On". This will show a search field above your table, and you can also add a placeholder text to increase the reader experience.
Enable table sorting
If you want your reader to be able to sort table data, you can simply tick the "Sortable" checkbox.
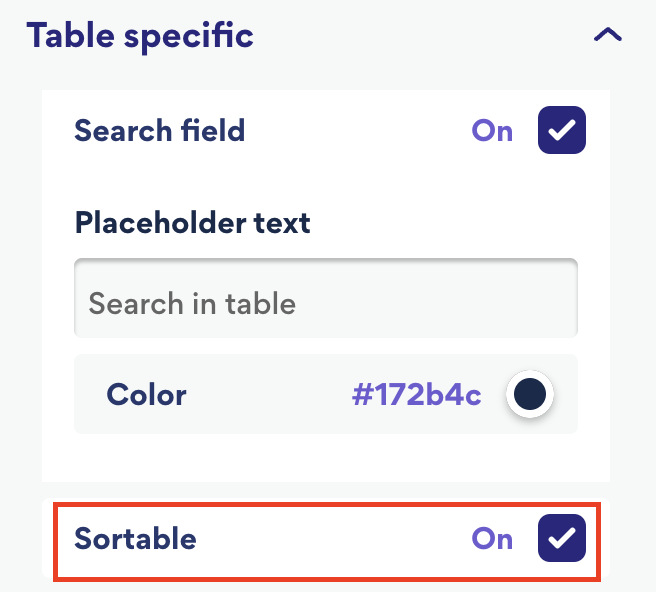
Please note, that the sorting functionality will only be available after you publish your table.
Show cards on mobile
If you have a table with many columns it can be challenging to use on a small mobile screen. 
The "Show as Card View on Mobile" will display your table as cards for a mobile-optimized interface
Table pagination
Table Pagination is a simple navigation method that lets you split a table with large amount of content into smaller parts.

In the pagination section you can customize how many results to display on each page, and style the paging buttons
Table Style - Global styling
In the Font and styling section, you can customize global styling options for your entire table. Pick your favorite font, alignment and font styling. See this help doc to learn how to upload your custom font.
Table Header style
In the Header section you can customize the header rows styling in your table.
Choose fonts, color, positioning to match your corporate style.
If you need more than one header row, insert a number indicating how many rows you want to use in the "Header rows" field. If you don't want any headers, set "Header rows" to '0', or alternatively right-click the header and delete the row.
Striping rows, aka. Zebra striping
Enable Stripes if you want to have a faint shading to alternative lines in your table. This technique is also known as Zebra striping or candy striping.
Choose stripe color and text color in this section.
Columns
Drag and drop column names to change the order.
Menu options
Context Menu Options allows the reader to download the chart as a PNG or JPEG image, PDF document, CSV or XLS. 
Add a chart to a table
In the chart section you can enrich your table with small charts, aka. sparklines or mini charts. 
Try it yourself:
- Open the table in the editor
- Select the cells in the column you wish to highlight by clicking and dragging with the mouse cursor
- Select the fill button to open the color picker
- Enter a hex code or use the color picker to select a color
The toolbar at the top allows you to customize individual cells in your table. From this toolbar you can align text, change styling, add borders, add links, merge cells and more.
Note: The toolbar does is disabled when linking chart data to a Google Spreadsheet.
Add Links to table data
Highlight the text in a cell and click on the Link icon in the toolbar. This will open a dialog where you can insert the URL. Click Save to update the cell.
Subscript / Superscript
A subscript or superscript is a character (such as a number or letter) that is set slightly below or above the normal line of type
To use subscript or superscript in any of your cell data, highlight desired text and click on one of the following buttons in the toolbar 
Add or remove rows and columns
If you want to add or remove rows or columns, Use the + button. This opens a context menu. Choose desired action. Deleting or adding will happen related to which cell you have selected 
The same menu can be accessed if you right click in any table cell.
Merge cells
To merge cells, select desired cells you want to merge and click the merge button.
Click on the border control to style the border of selected cells. Choose border style, color, thickness and more.
Highlight a table column with color
Use the fill function in the table toolbar to highlight certain areas of a table.
Try it yourself:
- Open the table in the editor
- Select the cells in the column you wish to highlight by clicking and dragging with the mouse cursor
- Select the fill button to open the color picker

- Enter a hex code or use the color picker to select a color

Highlight values in a single column
- First remove the header row at Header > Header row 0

- Select the values in the column you want to highlight
- Bold the values in the table toolbar
