Adding and adjusting your data
Data is the basis of your chart or graph. In this chapter, learn how to adjust it in different ways to achieve the desired visualization.
In this article:
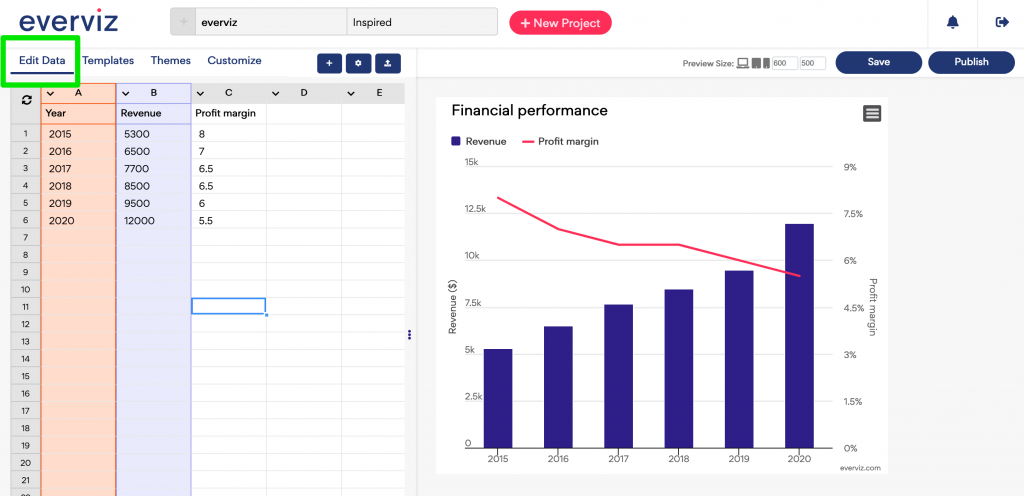
Use the Edit Data view to change the data for your Project and assign data to your visualization.
Data grid
The Edit Data grid gives you some of the basic capabilities you can find in a typical Spreadsheet editor such as:
- Edit cell data
- Change header
- Insert new rows
- Insert new columns
- Delete rows
- Select cells
- Sort Data
Import data
To import new data to an existing Project, simply drag a csv file directly onto the data grid or paste your data into one of the cells.
Clear data
To clear your data, select all cells and hit the delete button on your keyboard.
Sort data
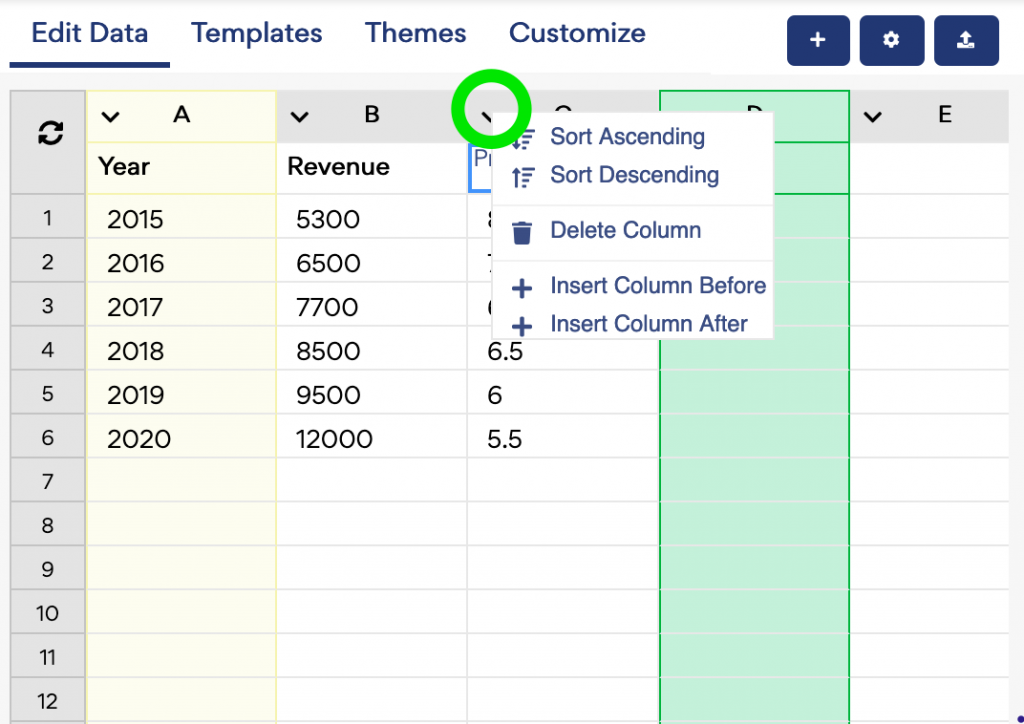
Click on the arrow in the next to the column identifier.
This opens a context menu. Here you can choose to Sort data Ascending or Descending.
Add and assign Data to series
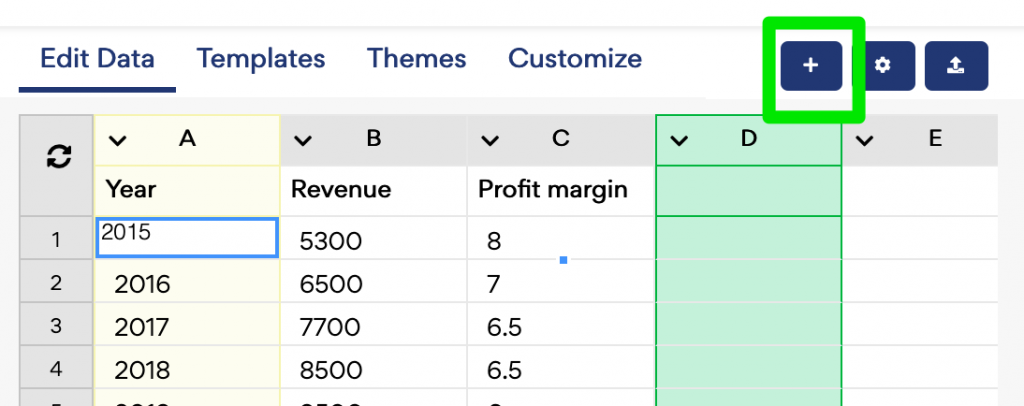
Add a new series
1. Click on the plus button.
Assign data to your series
To assign data to your series, click on the Settings cog icon:
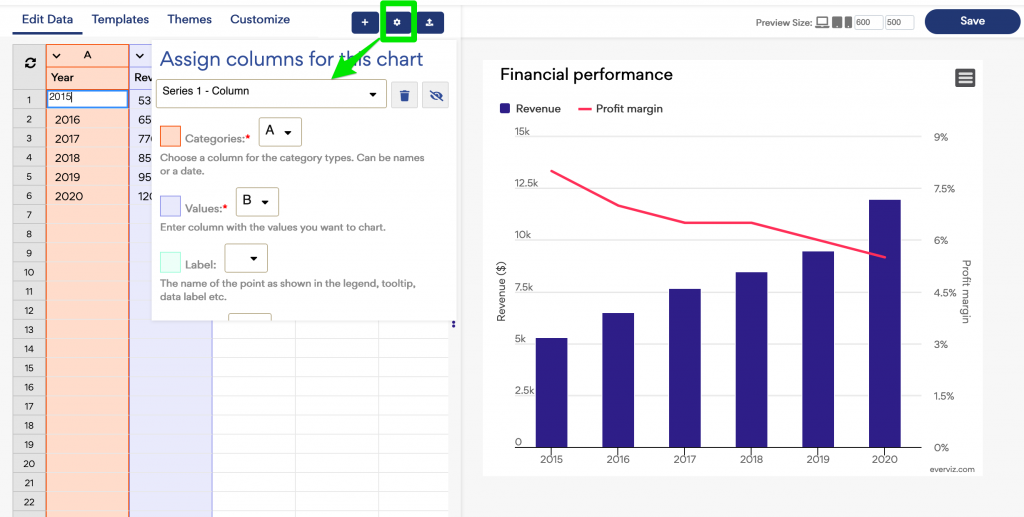
Each series has a set of columns. In the screenshot above, the first series (Revenue) has the categories at column A and the values at column B.
Change the values column
To change the values’ reference for the Series A from B to C:
Select the C column in the Values field.
Add data labels
In the Assign dialog you can also configure which column in the data grid you want to present as labels.
In the Label dropdown, choose which column you want to appear as Data labels.
Delete a series
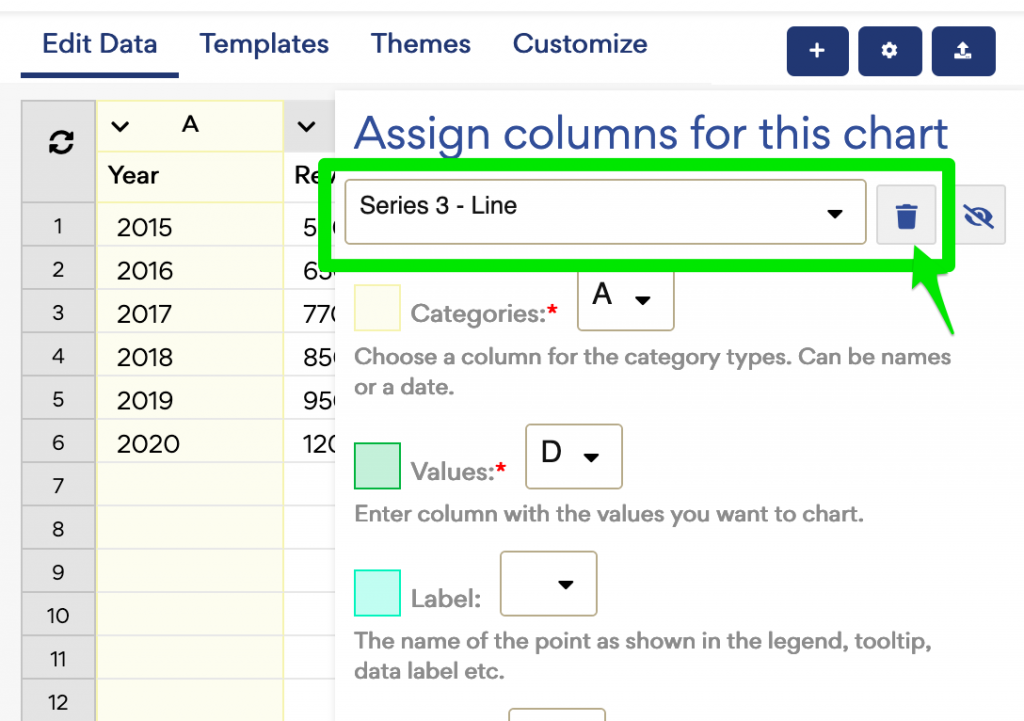
1. Open the settings dialog by clicking the Settings cog
2. Select the Series you want to delete in the dropdown, and click the delete icon.
Export Data
If you only want to export the chart's data in CSV format
1. Click on the button Export Data.
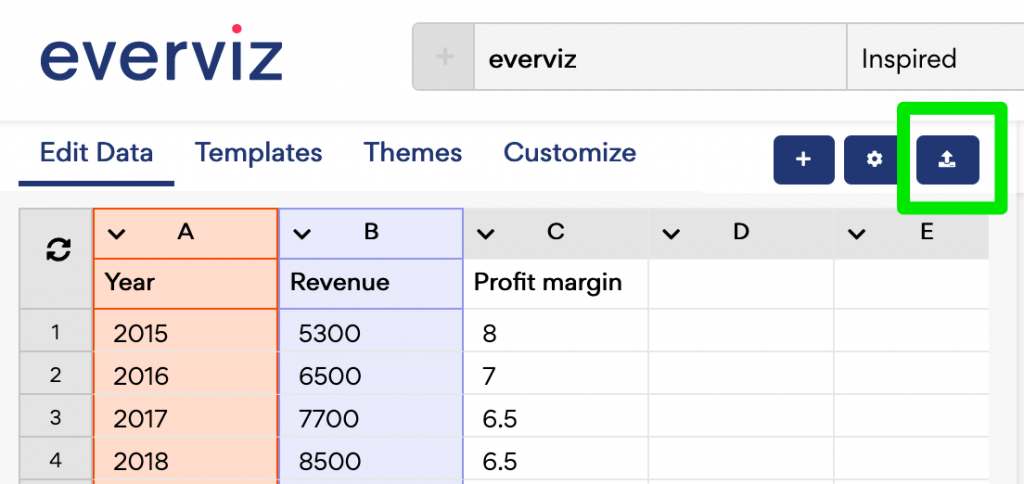
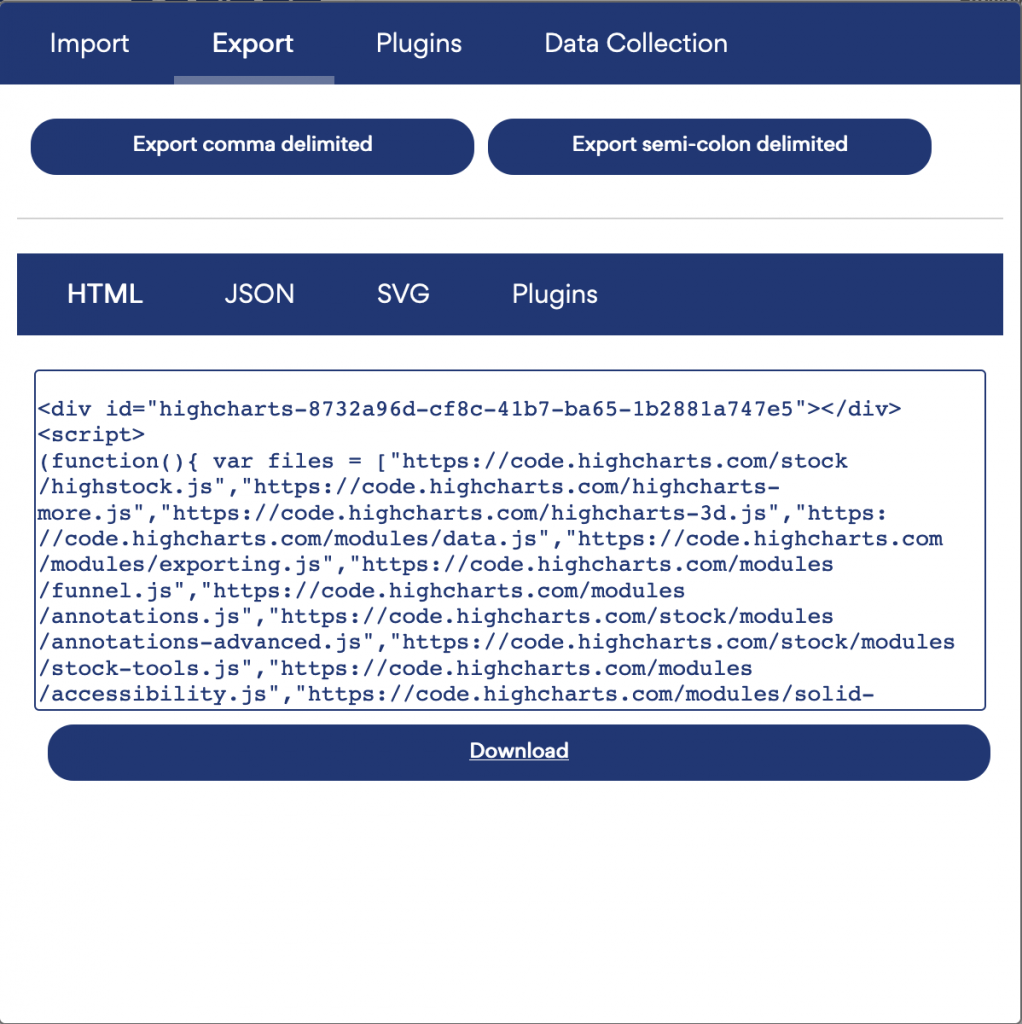
2. Select the Export tab.
3. Choose between the Export comma delimited or the Export semi-comma delimited.
Export the chart, including data
Export charts within three different formats:
- HTML: As an interactive chart in a standalone webpage.
- JSON: Saved as an Highcharts configuration file, to be shared with a developer for example.
- SVG: A static chart in the SVG format.
To export a chart:
- Click on the button Export Data.
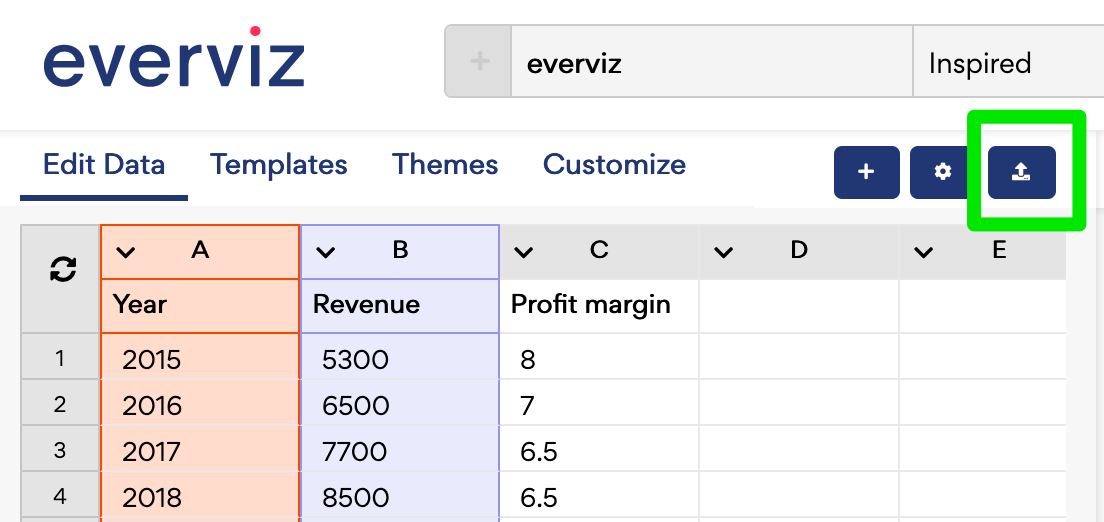
- Select the Export tab.
- Select the export format HTML, JSON, SVG.
- Copy the script’s format then click on the button Download.
