Google sheets add on
The everviz Google Sheet Add-on makes it convenient to connect Google Spreadsheet data to your chart.
Follow the steps below to learn how to install and use the Add-on.
Important!
The current version of this add-on does not support login if you used "Sign up with Google" when creating an account at everviz.com. It only supports login with a separate email address and password.
In this article:
Install the Add-on
- From a Google Sheet, Select the Add-ons menu, then click Get add-ons...
- Search for “everviz” then hover over the card and click +Free.
- Follow the prompts to give the add-on access to your Google spreadsheet.
- To open the everviz add-on, simply select the Add-ons menu -> everviz -> Open.
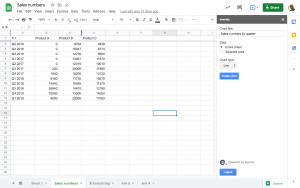
- Now you’ll see a panel on the right side of the page where you’ll be able to create a chart directly from your sheet.
Usage
- Sign in to everviz using your everviz credentials.

If you don't have an everviz account, click on the Sign up here link and follow the prompts to create one. Currently, the add-on does not support sign in with Google account.
- Add a title to your chart in the Chart title field

- Specify whether you would like to use all data in the active sheet (Entire sheet), or your Selected area
- Choose Chart type. Note that the add-on is currently limited to Line, Area, Bar, Column and Pie. If you need a different type you can change template in everviz after creation.
- Click the Create chart button. The chart will now be created and you can continue to customize the chart in everviz.
Click on the thumbnail to open the chart in everviz

everviz cannot access private data. Ensure that your sheet is published by going to File > Publish to the web before you create a chart. More information here: Google Sheet settings
Customize the chart in everviz
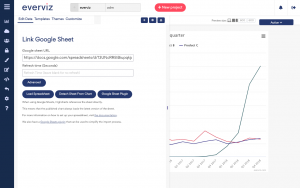
- After clicking the chart thumbnail in the Add-on, a new browser tab will open everviz and display your newly created chart.

If your chart is empty, there is a big chance that you forgot to publish the sheet. You can follow these instructions: Google Sheet settings and click on the Load spreadsheet button.
- If you want to let everviz poll for changes in the Sheet automatically, you can insert a poll interval in seconds in the Refresh Time (Seconds) field.
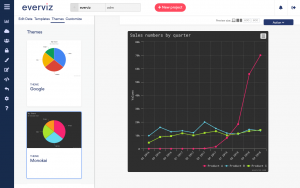
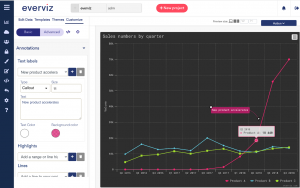
- Now you should be ready to customize your chart with theme, annotations and all the other options everviz empowers you with:


