Customizing chart text
This article describes how you can change all textual output in your chart or map. Text can be changed inline in the preview or from the left Text panel in the editor.
Tip: All chart customization is carried out in the editor.
Inline edit
Title and subtitle are used as the main captions for the chart or map and can be changed inline in the chart preview.
An inline popup to change the textual content and design options can be found when clicking on any of the fields for Title, Subtitle, Credits, Caption and axis titles.

Edit text using the editor
If you prefer to have access to all textual fields in one pane, you can open the Text panel on the left side in the editor.
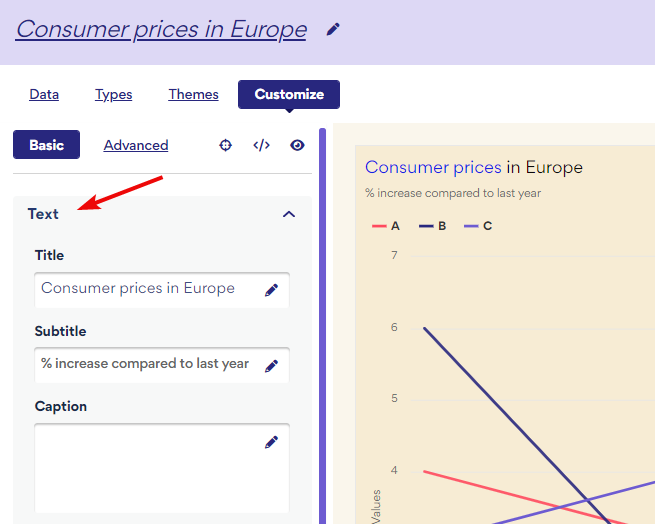
From this panel you can change:
- Title
- Subtitle
- Caption
- Credits
- Horizontal axis
- Vertical axis
When typing text in any of these fields, an instant preview appears in the chart preview on the right.
If you want to change the styling options on the text, click the pen icon next to the text. This opens a little WYSIWYG rich text editor where you can customize styling without any coding. 
Also notice that the background color of the rich text field will represent your chosen backgound for the chart to give a nice preview of the textual output. In the example below, we have changed the chart background color to dark, and notice that the editor background reflects this to give you good contrasts.
