Misc
In this article:
- Web browser support
Any modern web browser can be used with everviz. Keep in mind that using a recent version of Firefox, Chrome or Safari is recommended.
- Do I have to publicly publish my Google Spreadsheet to the Web before I can import it?
Yes, Google Spreadsheet has to be public to allow the code to access it. The data will not be pulled into the chart if the Google Spreadsheet is set to "private”.
- Set up an annotation's background as transparent
To set up a transparent annotation's background:
1. Create the label: go to Customize -> Advanced -> Annotations. Create your annotation, create your label by clicking on Labels.
2. Change the background: select the label that you want to change the background Labels[x] -> Background Color, and write "transparent" in the color field.
- Add click events to points on a chart or map
Add a click event to your chart or map which window.opens a URL stored in that point's extra field.
While everviz does not directly support adding click targets to points on a chart, you can leverage our direct integration with Highcharts to add some code to run the map is clicked.
The following snippet opens a URL in your visitor's browser when she clicks it. It can be copied and inserted directly into the custom code editor.
Highcharts.merge(options, {
    events: {
        click: function(event) {
        const url = event.point.extra;
        window.open(url);
    }
})
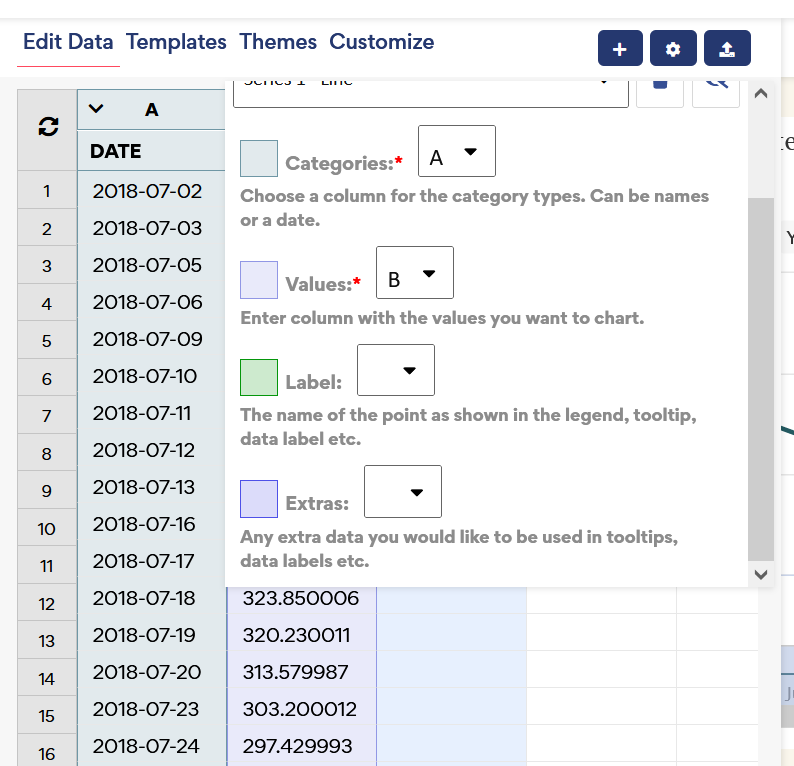
Notice how url is constructed from point.extra. This field is set as part of your data, and is picked by selecting the Extras column in the column picker, opened by clicking the cogwheel in the Edit data tab.
The click event is documented here in api.highcharts.com.