The publishing step in the wizard
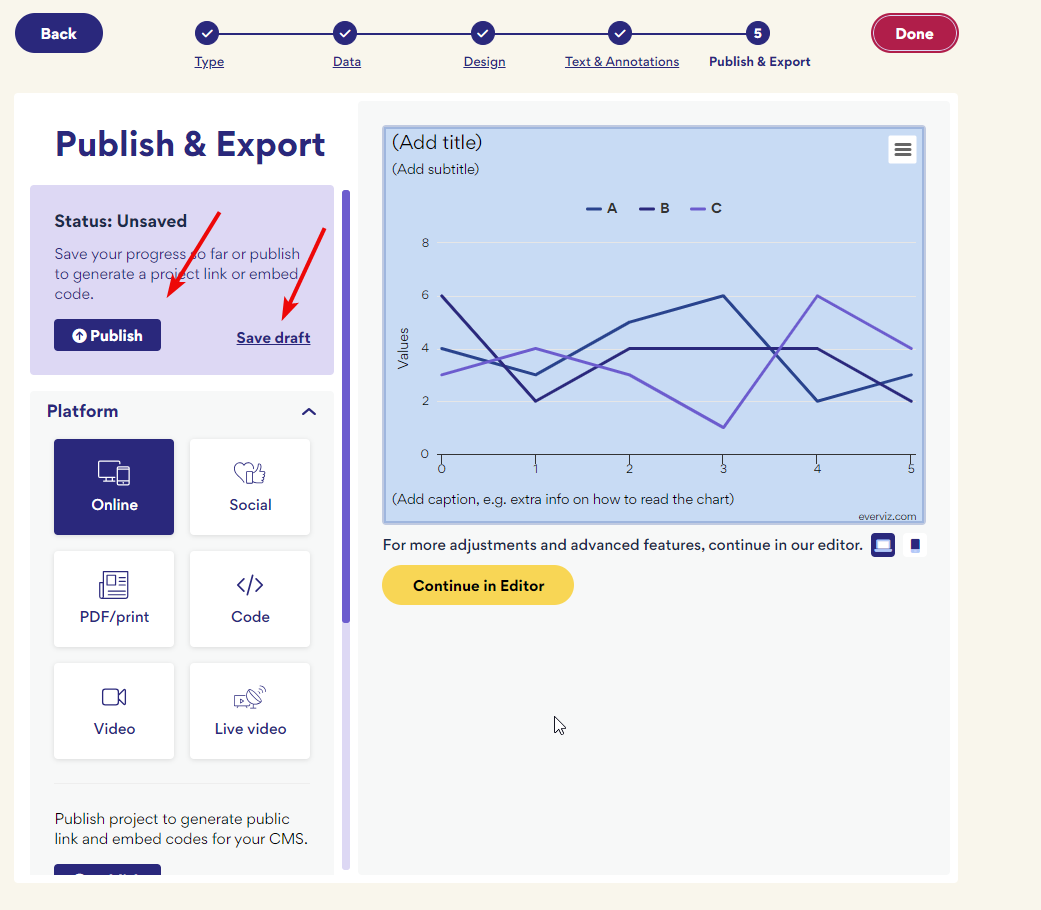
The publish panel appears on the final step of the project wizard. The panel has options for saving, publishing or downloading your project.
Saving and publishing
After clicking Publish the text on the button changes to Published. Click Unpublish to deactivate the embed codes and links to the project. This removes a chart from wherever it is published. If you decide to re-publish the chart, simply click Publish and the chart will appear again.
Export your chart
- Online
- Social
- PDF/print
- Code
- Video
- Live video
Online
Choose this option if you are embedding your chart on your website.
Clicking Publish generates the embed codes to be pasted into your CMS or elsewhere; it does not make your chart public. Charts are only visible once they have been inserted on a webpage or elsewhere.
- Script (Recommended) makes the chart part of your page allowing it to be styled by you, and scales to automatically to fit screen size
- iframe includes the chart in your page through a window that has fixed height. Advisable only if your CMS does not support scripts.
- Embed link to the visualization only, covering the full page. Used when embedding to PowerPoint, or platforms such as Medium.
Social
Export a chart as an image in a resolution suitable for Facebook, Instagram, Twitter/X and LinkedIn.
Click Channel to select a social media platform. Format contains a list of picture formats, including PNG, JPEG, SVG and PDF. Set the image orientation in Post dimensions. Set a custom image resolution with the export width and height options.
Click Export to download the image to your download folder.
PDF/print
Export the chart for use in an offline format or as PDF.
Code
Download a chart for self hosting. Two formats are available for download: HTML and JSON.
Video
Download a transparent version of the chart to overlay on top of video. Currently, MOV is the only supported format.
There are three options in the frames per second (FPS) menu:
- 60 FPS (Web) is a frame rate of 60 frames per second specifically optimized for web-based content
- 50P (Pal) is a frame rate of 50 frames per second and is associated with the PAL (Phase Alternating Line) television standard. 50P stands for '50 Progressive,' meaning means that each frame of the video is displayed progressively, one after the other, without interlacing.
- 60i (NTSC) is a video format with a frame rate of 60 fields per second (60i) that is associated with the NTSC (National Television System Committee) television standard. 60i stands for '60 Interlaced.'
Live video
Use this option for embedding a chart into a live broadcast. Clicking publish generates a chart embed link to be pasted into a Viz Flowics HTML graphic template.

An everviz donut chart inserted into a Viz Flowics graphics template.
Password protect a chart
Share to everviz inspired
Note: When publishing as SVG, JSON, HTML, custom fonts uploaded by you are not available.
Continue in editor
The project wizard contains only a handful of the customization options available in everviz.
Access the full customization power of everviz in the everviz editor by clicking Continue in editor.
The editor allows you to fine tune the look and feel of your chart to match your exact specifications. Edit chart elements such the color and size of the axis and axis lables, the information that appears in the tooltip and the position of the legend.