everviz for beginners
Welcome to this everviz tutorial that will get you up and running with everviz, regardless of your experience level.
This tutorial is ideal for complete beginners and those with prior experience. You will learn at your own pace, and the article will provide you will tasks to carry out as you build a chart.
After reading this page you will know the basics of using everviz. An everviz account is not necessary to complete this tutorial.
Why everviz?
Since you are here, let's go over the advantages of using everviz.
everviz is a visualisation tool that helps you create interactive charts and maps. It runs in the browser and no coding skills are required to use it. everviz charts are:
Learning everviz is easy as pie and completing this tutorial will get you on your way to creating more advanced charts in everviz.
Start for free
We will start off by opening everviz in the browser. Go to everviz.com and click Start for free.
At this point, you may want to open everviz in a different window or tab so you can follow the steps easier.
Select a chart type
The project wizard opens where you can choose between creating a chart or a map. Depending on your subscription type you may also be able to create tables and layouts.
Go ahead and click Chart.

The project wizard
We are now on to the first step in the project wizard. This is where you select a chart type you will create.
Now select a Bar chart.

Notice the chart loads in the chart preview window. And check out the description below. Each chart has one, helping you choose the right chart for your data.
Click Next.
Add your data
This is where you import your data. There are different ways to do this. Perhaps the easiest way is to copy and paste your data into the datagrid.
Try it out yourself. Copy the data from the 'Country' and 'GDP growth in 2018' columns in this spreadsheet.

Select a theme
These are the five standard themes built-in to everviz.
Go ahead and click a few of them and see how the look and feel of the chart changes.
Find one you like and click Next.
Describe the chart
Now you can try adding some text elements to your chart. You can add things like a chart title and subtitle and you can even add annotations.
Try adding a title and a subtitle. Notice it appears in the chart preview.
Go ahead and click the title in the preview window. This opens a rich text editor. Try left-justifying the title.
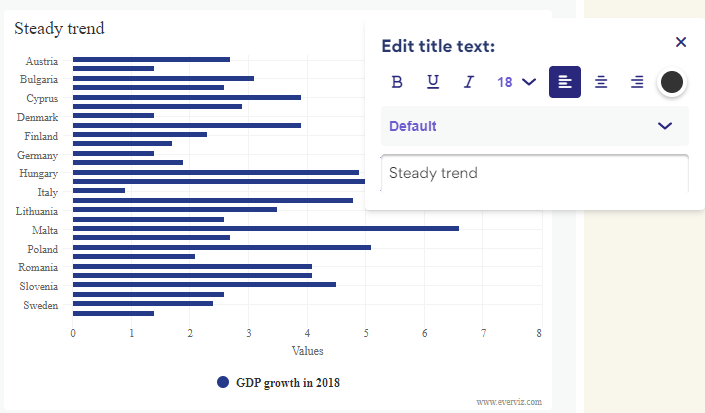
Try adding text into the different fields in this panel to get your chart just right.
Publish your chart
In the final step of the project wizard you are ready to publish your chart.
Click Publish to generate an embed code, which can pasted on your CMS or elsewhere online.

Next steps
From here you can enter the editor to access everviz’s full customization power.
We hope you enjoyed this everviz tutorial. There is much more to learn. Browse this knowledge base for tips and to learn the ins-and-outs of the app. To learn more you can also watch our library of on-demand training videos.